Subsidies under the Affordable Care Act (Obamacare) are based on a household’s Modified Adjusted Gross Income (MAGI) as it relates to the Federal Poverty Level (FPL.)
To qualify for subsidies, income must be greater than 100% FPL and less than 400% FPL (or greater than 138% FPL in states that have expanded Medicaid – currently 38 states + DC.)
MAGI is not an actual line item on your tax return and must be calculated. Often it is Adjusted Gross Income (AGI, Line 7 of your 1040) plus tax-exempt interest (Line 2a) minus IRA and HSA contributions. (Full details on how to calculate MAGI, pdf)
Percentage of Federal Poverty Level (FPL) for Obamacare
The following table shows income (MAGI) levels for various household sizes. FPL levels are higher in Alaska and Hawaii. (Source data.)
Health Insurance Premium/Subsidy Calculator!
For assistance with ACA premium and subsidy calculations, be sure to check out our simple yet powerful ACA calculator!
These are 2023 FPL numbers for 2024 coverage (health insurance for Jan 1, 2024 – Dec 31, 2024.)
| 2024 Enrollment (2023 data) | Percent of Federal Poverty Level (FPL) | 14580 | 5140 | |||
|---|---|---|---|---|---|---|
| Household size | 100% | 138% | 200% | 250% | 300% | 400% |
| 1 | $ 14,580 | $ 20,120 | $ 29,160 | $ 36,450 | $ 43,740 | $ 58,320 |
| 2 | $ 19,720 | $ 27,214 | $ 39,440 | $ 49,300 | $ 59,160 | $ 78,880 |
| 3 | $ 24,860 | $ 34,307 | $ 49,720 | $ 62,150 | $ 74,580 | $ 99,440 |
| 4 | $ 30,000 | $ 41,400 | $ 60,000 | $ 75,000 | $ 90,000 | $ 120,000 |
| 5 | $ 35,140 | $ 48,493 | $ 70,280 | $ 87,850 | $ 105,420 | $ 140,560 |
| 6 | $ 40,280 | $ 55,586 | $ 80,560 | $ 100,700 | $ 120,840 | $ 161,120 |
| $ increase / additional person | $ 5,140 | $ 7,093 | $ 10,280 | $ 12,850 | $ 15,420 | $ 20,560 |
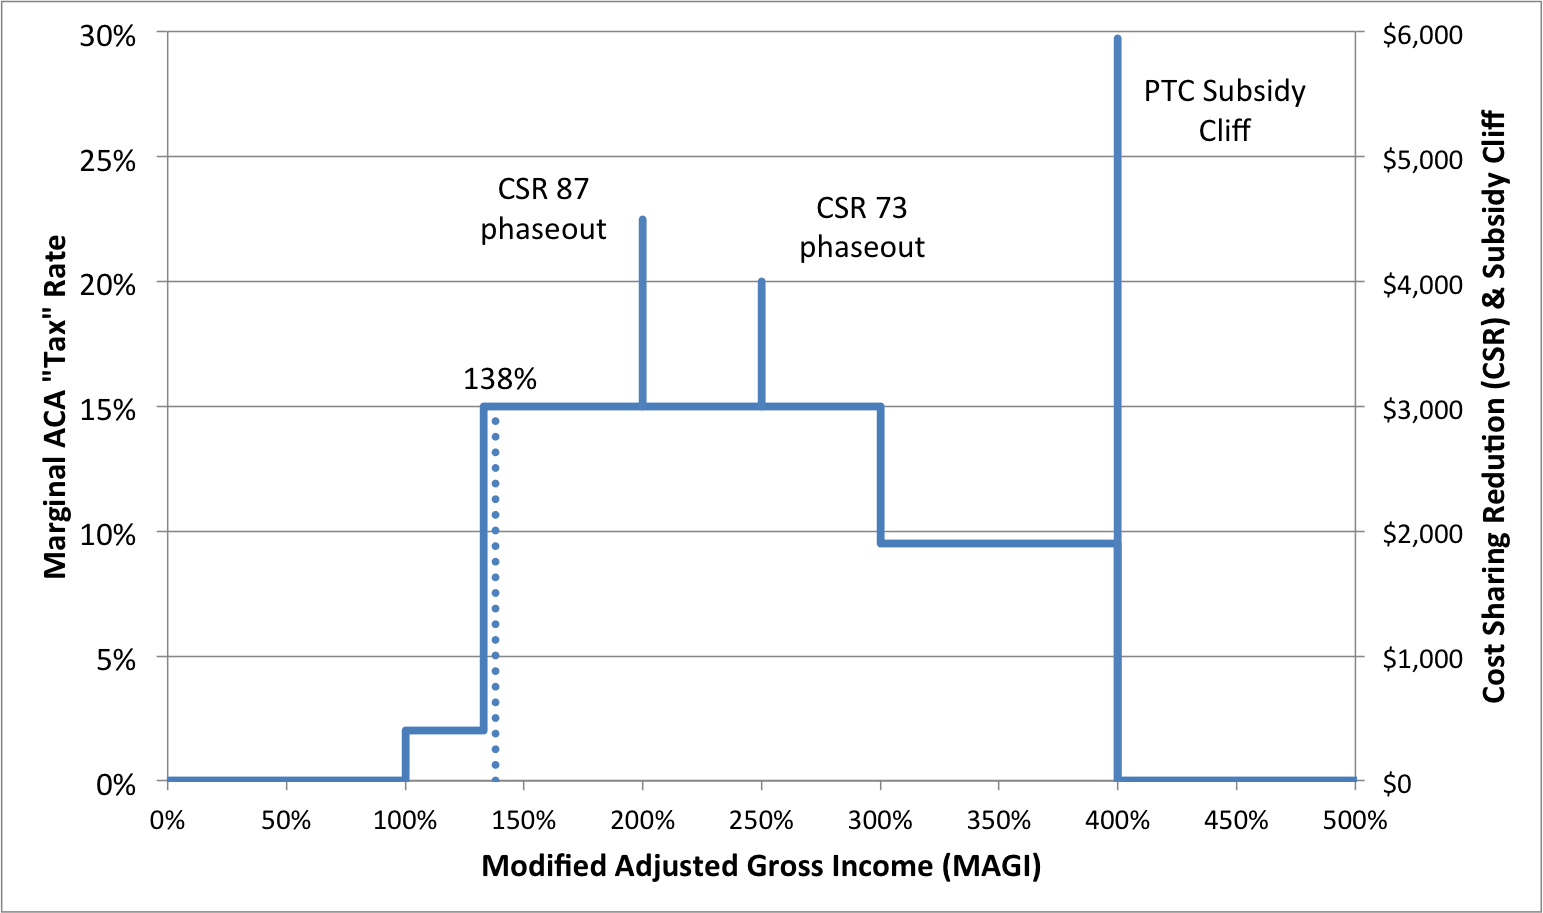
The chart below highlights how ACA premium and cost-sharing subsidies are reduced with increased MAGI. For full details, see the post, Obamacare Optimization vs Tax Minimization.
Affordable Care Act Tax Profile
Data for previous years
2022 FPL numbers for 2023 coverage (health insurance for Jan 1, 2023 – Dec 31, 2023.) (Source data.)
| 2023 Enrollment (2022 data) | Percent of Federal Poverty Level (FPL) | 13590 | 4720 | |||
|---|---|---|---|---|---|---|
| Household size | 100% | 138% | 200% | 250% | 300% | 400% |
| 1 | $ 13,590 | $ 18,754 | $ 27,180 | $ 33,975 | $ 40,770 | $ 54,360 |
| 2 | $ 18,310 | $ 25,268 | $ 36,620 | $ 45,775 | $ 54,930 | $ 73,240 |
| 3 | $ 23,030 | $ 31,781 | $ 46,060 | $ 57,575 | $ 69,090 | $ 92,120 |
| 4 | $ 27,750 | $ 38,295 | $ 55,500 | $ 69,375 | $ 83,250 | $ 111,000 |
| 5 | $ 32,470 | $ 44,809 | $ 64,940 | $ 81,175 | $ 97,410 | $ 129,880 |
| 6 | $ 37,190 | $ 51,322 | $ 74,380 | $ 92,975 | $ 111,570 | $ 148,760 |
| $ increase / additional person | $ 4,720 | $ 6,514 | $ 9,440 | $ 11,800 | $ 14,160 | $ 18,880 |
Previous years’ data available here.